OneZoo R course pre-worksheet:Introduction to R
Prerequisites
Users able to install and run programs on their operating system.
Users understanding file management on their operating system.
Worksheet introduction
This worksheet should be completed before the commencement of session one on day one (please aim to do it in advance so we can assist if there are any problems). It should not take you long, if you have used RStudio to any standard before this should be straightforward. Completing this worksheet is crucial to minimise setup time and maximize your learning experience for complete R beginners. If you encounter difficulties with the installation steps, it is essential you reach out to the research software engineer (RSE) team. Please give this worksheet your full attention and follow the instructions carefully.
Why are we learning R?
Upon completing this course, R will emerge as an additional tool set to enhance your research capabilities. You will gain the ability to analyse data you have collected from experiments. You will be encouraged to do so in a repeatable, scalable, and sophisticated manner. R will support you to streamline your workflow, generate insightful visualisations and improve the reproducibility of your research. By learning R you will also become part of a growing online scientific community where you can seek support and find possible collaborations.
Section 1 - Installing R and RStudio (Windows, Linux & Mac)
Note 1: If you’ve previously installed RStudio before this course, you can bypass this section. However, please ensure you have the latest version installed (you should receive a notification if an update is required when you open RStudio).
Note 2: We will be using RStudio for this course. While there are alternative options available, RStudio is widely regarded as an excellent choice due to its extensive community support and user-friendly interface. If you are already using an alternative, you are welcome to continue using it; however, we would recommend using RStudio as we cannot provide support for alternatives during this course.
Firstly, we need to ensure that your personal system is set up correctly. Please click on the link below or copy and paste it into your browser. Follow the instructions on the page to install R and RStudio. Note that there are separate instructions for each operating system (OS). Choose the instructions that correspond to your machine’s OS.
If the distinction wasn’t clear during installation, it’s important to note that R and RStudio are separate entities. R serves as the programming language itself, while RStudio functions as an integrated development environment (IDE). RStudio is specifically designed to provide an interface and toolset that simplifies the process of writing efficient, readable, and maintainable R code.
Note: If this is the first-time installing R and RStudio you may be asked some set up questions on your first initialisation. Choose the default options rather than any custom set-up.
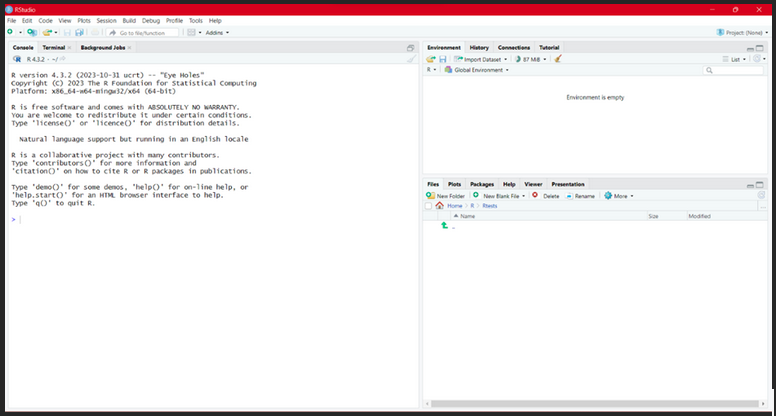
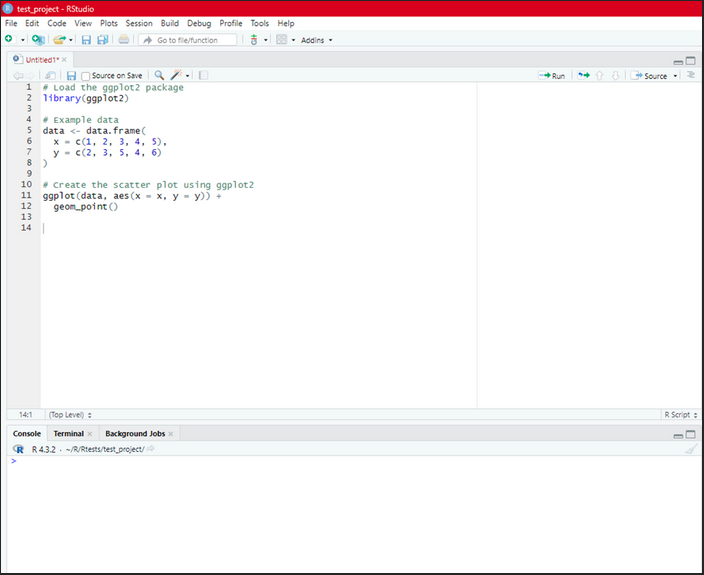
If everything has gone smoothly you should now be able to open RStudio and be presented with a screen that looks something similar (dependant on your OS) to the image you see below. If that checks out, you can move on to section 2.
Section 2 – First steps
Familiarise yourself with the RStudio layout
- The interactive R console/Terminal (entire left)
- Environment/History/Connections (tabbed in upper right)
- Files/Plots/Packages/Help/Viewer (tabbed in lower right)
We will explore this in more detail during our introduction session.
Reminder: This worksheet is not exploring concepts in detail; our aim is to ensure you are ready for the course.
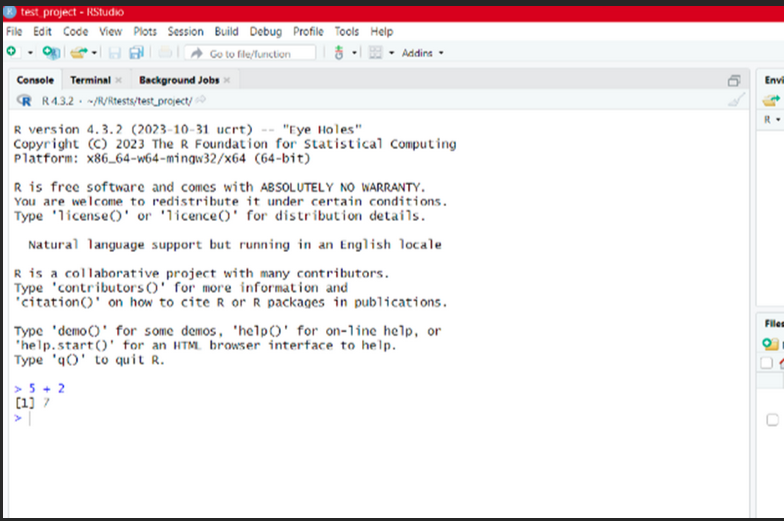
Task 1: Ensure your cursor is flashing in the console screen and enter
5 + 2
Followed by the return key (enter key). You should now have something that looks like this
Task 2 – Now try these three commands, type them separately, complete each line with enter
pi

sqrt(9)

sin(1)
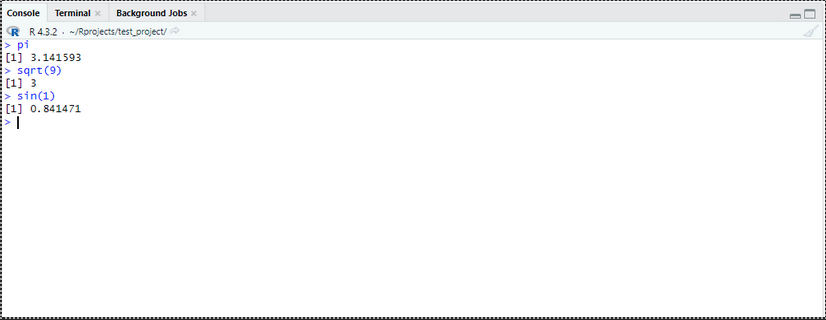
This is an extremely brief introduction to inbuilt functions and variables. Hopefully these inputs are decipherable to you and the results are not surprising. You should see an output for all inputs (see screenshot).
Task 3 – Set up a project
Project management is important to ensure maintainability and collaboration. Minimise RStudio and create a folder (call it something explanatory like “r_projects”) in a location that is convenient for you. Now go back to RStudio and from the main menu select ‘File’ > ‘new project’ > ‘new directory’ > ‘new project’. You will be prompted for a directory name for your project and a file path where you want to create the project. Name your project something that you can easily identify like “OneZooRCourseWorksheet1” and choose the folder you just created as your file path.
You should now have created an R project. You can explore this project from your file browser, and you may notice you have a file that is of type ‘R Project’. You can run this file to load a project into RStudio (not so useful now but possibly advantageous in the future if you have many projects). Go back to RStudio and type:
getwd()
This should now show your current working directory (wd) is the path and project you specified. This is important for project organisation and data import and export.
Task 4 - Packages
We need to ensure you have a series of packages installed for this course. We already have a very limited time, so we do not want to waste it installing packages. In the console in RStudio type:
install.packages("ggplot2")
You may get a warning message related to Rtools. This is normal and should not obstruct you from installing other packages or completing the worksheet.
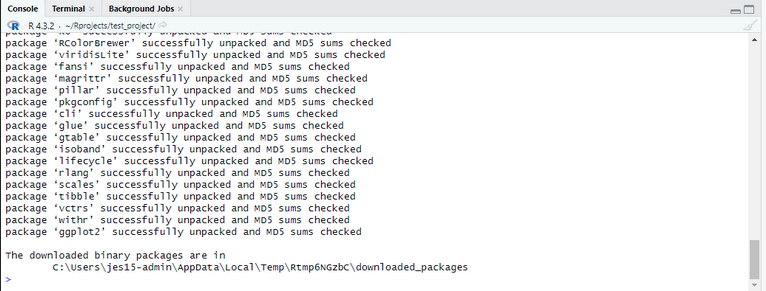
Note: if this is not your first time using RStudio and ggplot2 you do not need to run this line. If you do you will get a relatively short message informing you the packaged has been successfully unpacked.
You should see a set of messages informing you of all package dependencies that are being downloaded from various locations. Now open a new R script by pressing the green button with a white plus in it. This will open a new tab on the top left of RStudio. Scripts allow you to assemble commands and run them in sequence rather entering lines manually into the console like we have done so far.
Task 5 - Testing
Copy and paste the following into your new script (use the screenshot below for context):
# This loads the ggplot2 package you installed

library(ggplot2)

# This generates some simple example data

data <- data.frame(

  x = c(1, 2, 3, 4, 5),

  y = c(2, 3, 5, 4, 6)

)

# This uses the ggplot package to create a scatter plot displaying the data we created

ggplot(data, aes(x = x, y = y)) +  geom_point()
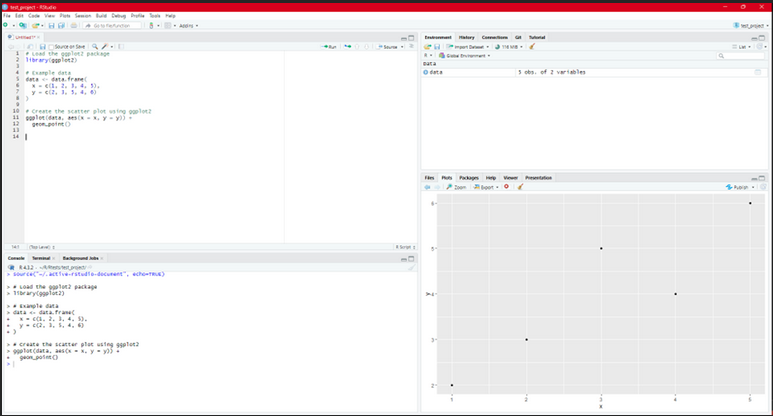
To give some context to those who are using R for the first time. The # signifies a note, it is a line that will not be treated as R language and is used to give explanation (to yourself and to others who might read your code) about what the following lines of code are doing. For the moment we are not going to consider any of the lines of code we are just going to trust the process and run the script by pressing Ctrl + Enter, or Ctrl + Alt + r (Linux or Mac OS) and Ctrl + Shift + Enter (on Windows OS).
If everything is correct you should notice two things. Firstly, you should be provided with a scatter plot in the plotting window (bottom right). Secondly, you should see that the lines in the script window have been processed in the console (bottom left). Your output should match the image provided.
You can now save you script by pressing the save symbol on the script pane. Name it something sensible like ‘simplePlotExample’.
Congratulations, that is the end of the technical sections of this worksheet. If you have no experience of R or programming, you may feel like you have more questions than answers at this point. This is understandable, as previously stated this worksheet is a preparation exercise to ensure you are ready for the course. If you were unable to complete any of the exercises, please contact cot13@aber.ac.uk before the course commencement data and we will assist.